
Since the introduction of smartphone into the market, every year has been awarded at the year of mobile phones. But 2014 witnessed the phenomenal growth in usage of mobile devices breaking all the earlier barriers; the propelled usage of smartphones has brought about good news for advertisers, marketers, publishers, OEMs, vendors, telecom carriers and app developers. However, as it happens in every business, revenue generated by all the concerned people is not the same, but varies upon different aspects. Revenue remains one of the major bases of deciding who the leader is, in terms of mobile platforms. Apple Inc. (NASDAQ:AAPL) iOS, that has sizable penetrated the mobile market with just handful versions of iPhones, iPads and iPods, continue to generate the maximum ad revenue, though Google Inc. (NASDAQ:GOOG) Android is rapidly inching forward, points out Opera Media Works in its ad economies report for the second quarter of 2014.
The two most important takeaways from the report are the revenue generated by health & fitness apps and sites, and the growth of mobile ad traffic. While the health & fitness apps and sites continue to generate maximum revenue per impression, the growth of mobile ad traffic grew aggressively by multi-folds in the Asia-Pacific region. All the figures mentioned in the report are accomplished by monitoring 14,000 sites and applications, taking into account 64 billion ad impressions per month, reaching more than 500 million global consumers in Q2, 2014.
Asia Leads In Ad Impression But Fails In Revenue
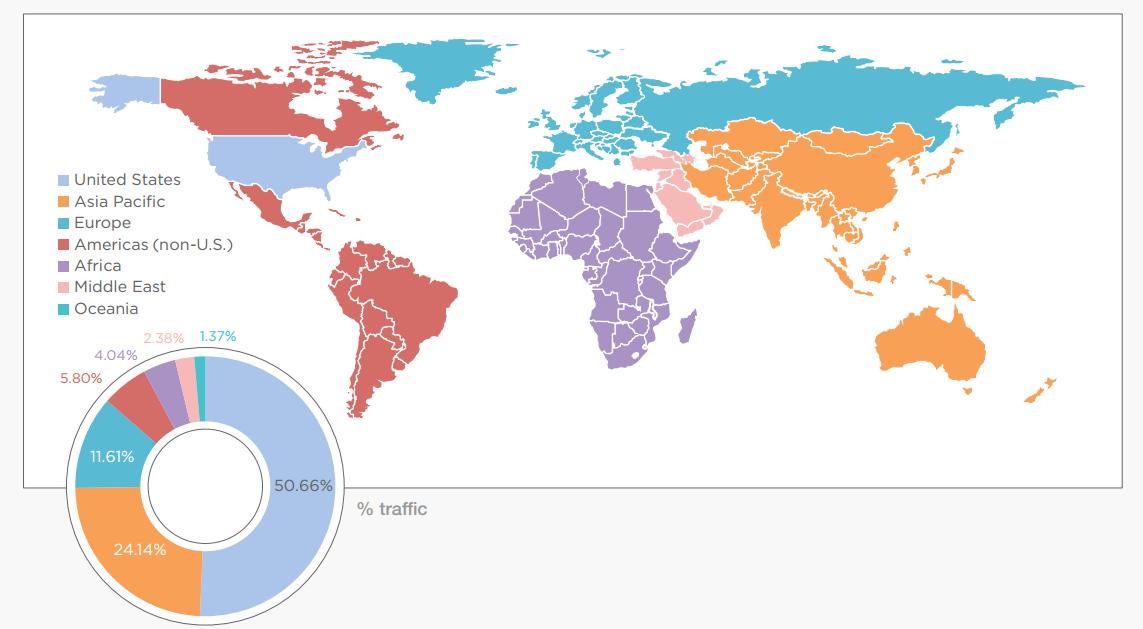
In 2013, Asia leapfrogged Europe to become the second largest continent by the number of ad impressions, and in Q2 2014, it increased its share in global traffic to 24.14%, a marginal increase of 1.29% point compared to Q1 2014. Asia is the most populated continent on earth and with the increasing penetration of mobile phones, the internet usage and the ad impressions are likely to grow, consequently.
Here, it’s important to understand how exactly ad impression is calculated; Ad impressions are the number of times an ad is seen; clicking on the ad is not taken into account. If a page displays three ads, the ad impression of that page would amount to three.
The United States alone accounted for more than half the total mobile internet traffic in Q2 2014. Recently eMarketer has estimated that the US would account for one-third of the global ad spending across all media in 2014. The Opera Media Works report claims the non-US regions of South America and North-America accounted for only 5.80% of total traffic in Q2 2014. The majority of ad impressions came from US followed by Asia-Pacific and Europe. The share of traffic generated from each region remained almost similar to the first quarter of 2014.
Android Inches Up On iOS for Monetization
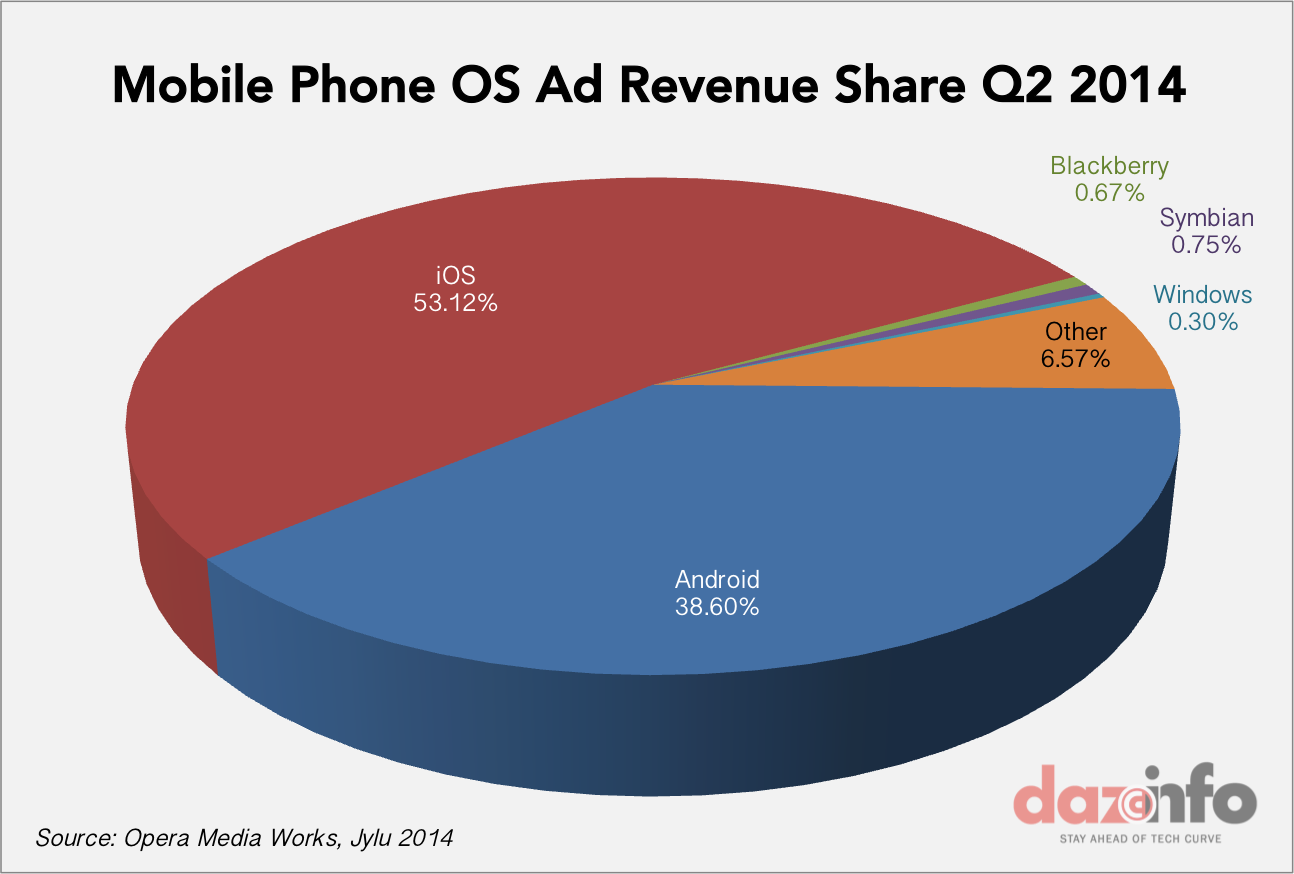
Since its release, iOS has clearly led in terms of delivering outstanding results to ad and app developers – be it monetary gains or traffic. But in 2013, Android leapfrogged iOS to become the leading smartphone platform in terms of traffic volume and ad impressions served. In the second quarter of 2014, Android accounted for almost half the internet traffic on mobile devices. However, iOS continues to generate more revenue from ads, though Android is rapidly moving forward. In just three months, the ad revenue generated on Android-powered mobile devices went up to 38.6% from 33.46% in Q1 2014. Android is not eating into the revenue generated by ads on iPhone, iPad and iPod, but it’s definitely hurting the revenue share of other platforms.
But, what is more interesting is that despite the marginal decline in iOS traffic share, the revenue share surged up. In Q1 2014, iOS accounted for 38.17% of total traffic, which declined to 37.21% in the second quarter of 2014. In contrast, the revenue share of iOS went up to 53.12% in the second quarter of this year from 52.27% in the previous quarter. This clearly signifies that the cost of each ad impression on iOS devices went up by in the last three months.
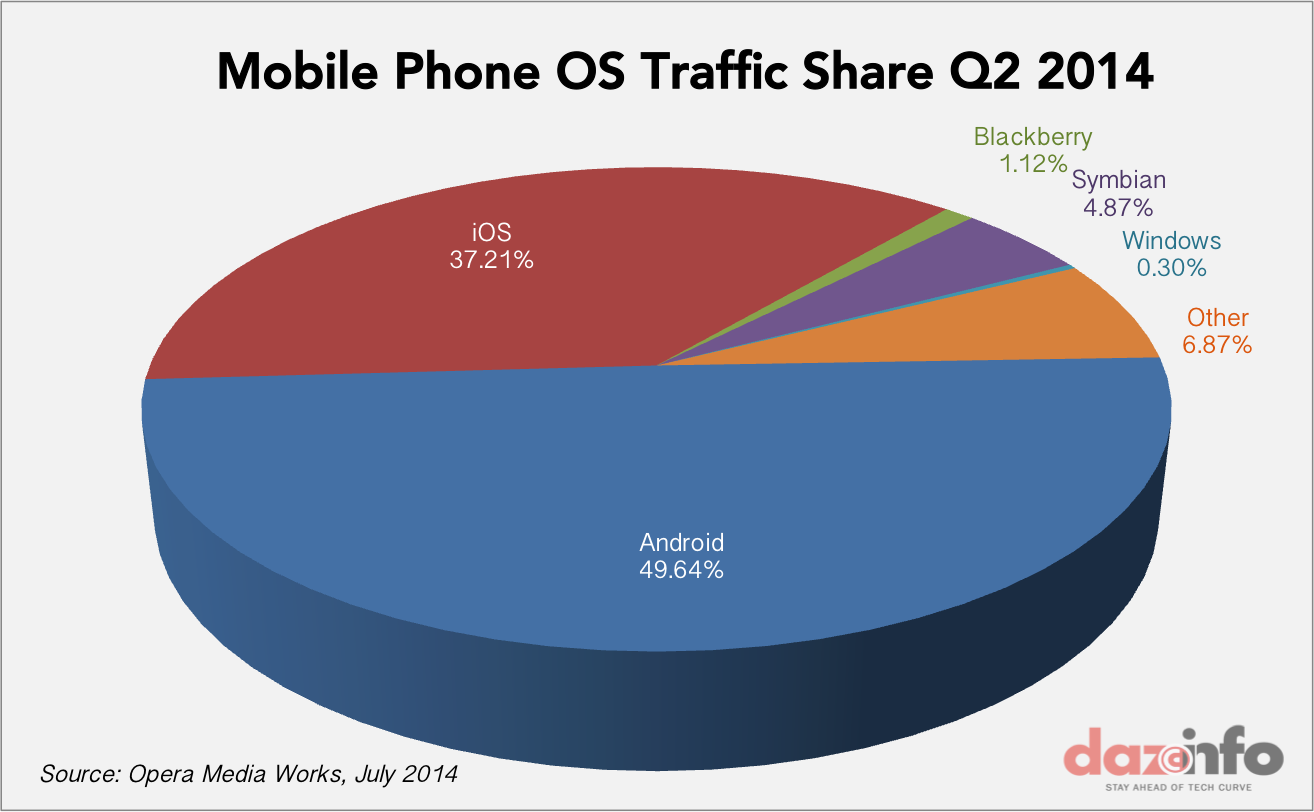
The smartphone market is flooded with Android-powered smartphones ranging in all prices. The increasing share of Android OS in the majority of mobile markets is a testimony to that. With increasing penetration of Android smartphones, it is unsurprising that Android continues to generate more traffic and serves more ad impressions.
Health and Fitness Category Generates Maximum Revenue per Impression.
It’s old news now that social media sites and apps generate the maximum traffic and ad impressions. Social Media is not the primary reason people are using mobile phone, there are many other online activities, mobile users are indulging with on their device. Propelled by watching the video, media sites that include music, videos and entertainment generated the maximum revenue in Q2 2014. Interestingly, Arts & Entertainment and Sports categories rope in double the share of revenue as against the share of impressions.
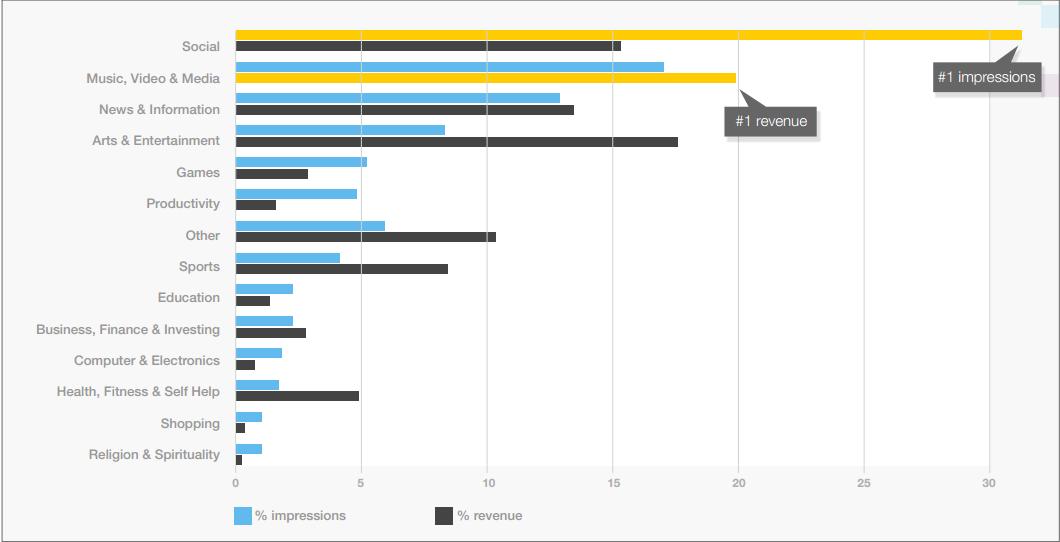
Categorically, Health & Fitness have grown to be an industry of their own. In the second quarter of 2014, it generated more revenue per impression than any other category. The growing usage of health and fitness apps in the US on iOS devices is fuelling the revenue growth. Previously, Banking, Finance & Investment categories generated the maximum revenue per impression.
To make sure the growth of ad impressions on mobile devices is not an easy task for developers. The growing number of smartphone platforms and the pressure on ad networks to deliver ads that suit all the platforms are causing fragmentation of technology, and to combat this, marketers and advertisers need to choose and create wisely. With the increasing smartphone penetration and data-hungry consumers, ad impressions, traffic and revenue generated is bound to bring cut-throat competition. For now, the leaders in traffic and revenue are differentiated but it will be fun to watch the cat-race.
Takeaways:
- Advertisers will have to shell out more money to promote their products/services on iOS devices.
- Entertainment apps and sites are still the main drivers of ad revenue.
- Productivity apps are failing to bring in more ad revenue for companies.
- For branding related campaigns, advertisers must prefer Android over iOS due to cost and reach constraints.

It is a documented fact that I-OS owns 85-90+ % of all e-commerce generated. Which is why AAPL has 53.12% of the market revenue in ads. Why advertise to people who don’t spend?
Android users are wannabe window shoppers.